This is the legacy API 1.0 version. the new API 2.0 version released by Sumo Logic, or Sumo Logic Siem should be used.
This article contains information on setting up and using the Sumo Logic app for Mimecast to visualize and analyze email event log data, including dashboards for email activity, spam detection, TLS, URL Protection, and virus detection. It is intended for Administrators.
The Sumo Logic app for Mimecast enables customers to visualize Mimecast event log data ingested by Sumo Logic’s Hosted Collector using the Mimecast Source, and gain insight into activity on your Mimecast tenant.
Dashboards
| Dashboard | Description |
|---|---|
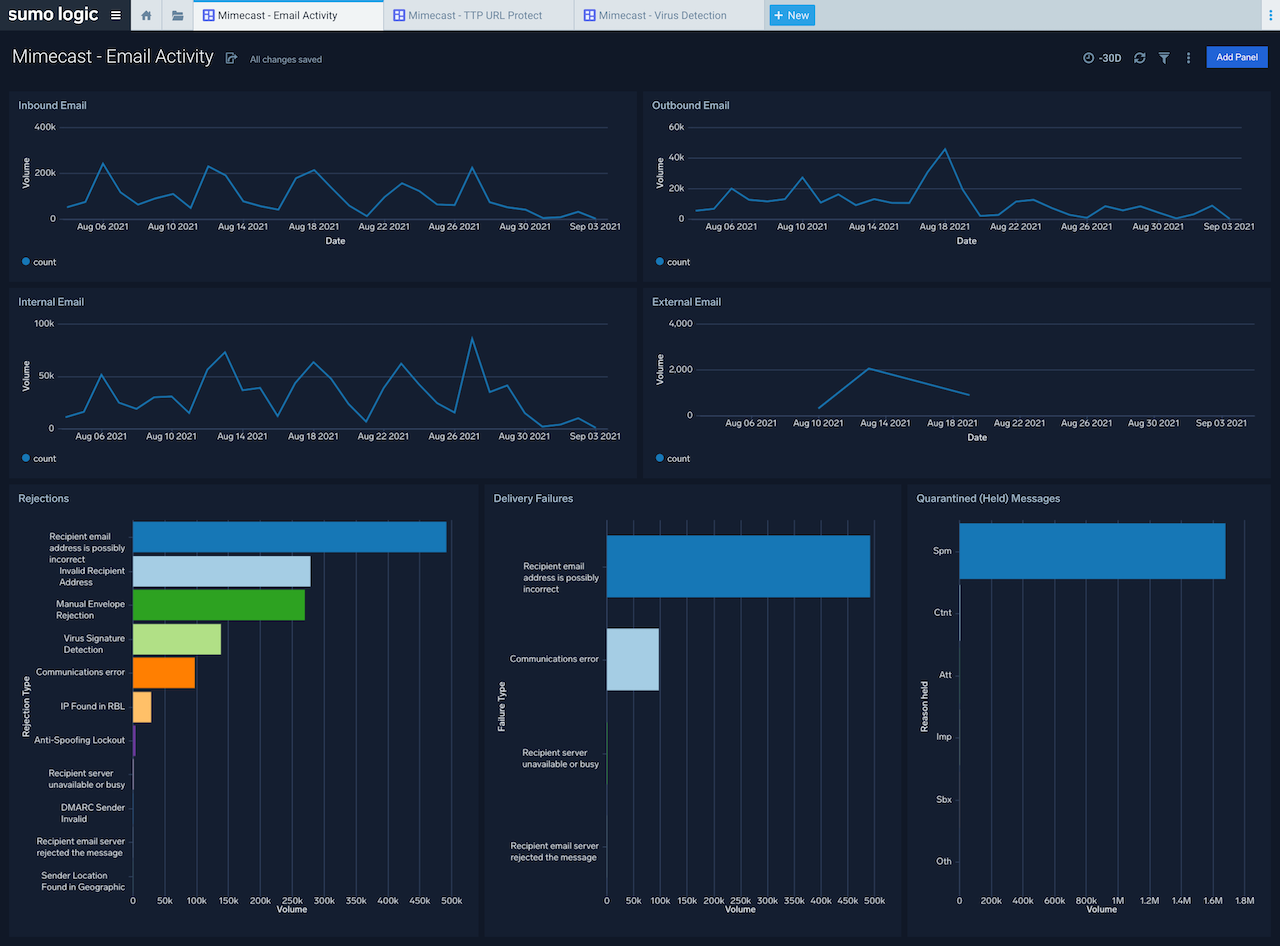
| Mimecast - Email Activity | Overview of email receipt, rejections, spam and quarantine events |
| Mimecast - Spam Detection | Overview of spam detection events |
| Mimecast - TLS | Overview of Transport Layer security |
| Mimecast - TTP URL Protect | Overview of URL Protect events |
| Mimecast - Virus Detection | Overview of virus detection events |
Log Types
The Hosted Collector Mimecast Source collects the following log types.
-
-
Receipt
-
Process
-
Delivery
-
AV
-
Spam Event Thread
-
Journal
-
TTP
-
URL Protect
-
Attachment Protect
-
Impersonation Protect
-
Internal Email Protect
-
-
Sample Log Message
Query sample
Collect Logs for Mimecast
This section contains instructions for collecting logs for the Sumo Logic App for Mimecast.
Step One: Register Sumo Logic API Application with Mimecast
- Log in to the Mimecast Administration Console.
- Select the Integrations | API and Platform Integrations menu item.
- On the Available Integrations tab, locate the Custom API Integration card.
- Click on the Generate Keys button.
- Set Application Name as Sumo Logic.
- Set Category as SIEM Integration.
- Service Application option Extended Session must be enabled.
- Provide a description within the Description text entry box.
- Click Next.
- Provide within the Developer text field, a name for the technical point of contact.
- Provide within the Email text field, a email address for the technical point of contact.
- Click Next.
- Review the Summary page before clicking Add.
- A slide out panel will appear, from this slide panel copy the Application Id and Application Key and store in a safe and secure location for later use in this guide.
- You will need to wait for at least 30 minutes before obtaining a Access and Secret key.
- Create a dedicated admin user with permissions to the following on the Mimecast tenant:
-
-
-
Gateway | Tracking | Read.
-
-
Step Two: Generating User Access and Secret Keys.
-
Click on the newly registered API Application from the application list.
-
Click on the Create Keys button.
-
The Create Keys wizard is displayed.
-
Enter the Email Address of the dedicated administrator user account.
You'll need to know the dedicated admin user's domain or cloud password for the next step.
-
Click on the Next button.
-
Select using the Type dropdown list, the authentication method (Cloud or Domain).
-
Enter the password for the dedicated admin user in the Password field.
-
Click Next.
-
The Access and Secret keys are displayed (masked) on screen.
-
Copy both Access and Secret keys, store these with the Application Id and Application Key obtained earlier while registering the API Application.
Step Three: Adding a Hosted Collector
To add a hosted collector, perform the steps as defined on the page Configure a Hosted Collector.
Step Four: Adding a Mimecast Source
To add a Mimecast Source, perform the steps as defined on the page Create a Mimecast Source.
Install the Mimecast App
Now that you have set up collection, install the Sumo Logic App for Mimecast in order to use the preconfigured searches and Dashboards that provide insight into your data.
To Install the Mimecast App:
Locate and install the Mimecast app from the App Catalog. If you want to see a preview of the dashboards included with the app before installing, click Preview Dashboards.
-
From the App Catalog, search for Mimecast and select the app.
-
Select the version of the service you're using and click Add to Library.
Version selection is applicable only to a few Apps currently. For more information, see Install Apps from the Library.
-
To install the Mimecast app, complete the following fields
-
- App Name. You can retain the existing name, or enter a name of your choice for the app.
-
Data Source. Select the below option for the data source.
-
-
- Choose Enter a Custom Data Filter, and enter a custom source category beginning with an underscore. Example: (_sourceCategory=Mimecast). This should match the _sourceCategory for the Mimecast Source, if this value has been changed from the default.
-
-
- Advanced. Select the Location in Library (the default is the Personal folder in the library), or click New Folder to add a new folder.
- Click Add to Library.
Once the Mimecast app is installed, it will appear in your Personal folder, or the folder that you specified. From here, you can share it within your organization.
Panels will start to fill automatically. It's important to note that each panel slowly fills with data matching the time range query and received since the panel was created. Results won't immediately be available, but with a bit of time, you'll see full graphs and maps.
Dashboard One
Overview of email receipt, rejections, spam and quarantine events.
This dashboard can be used to:
Monitor inbound, outbound, internal and external mail volumes, delivery failures, rejections and held messages.
Dashboard Two
Overview of spam detection events.
This dashboard can be used to:
Monitor spam detection volumes, top 10 spam signature detections and targeted users, spam detections by source IP address and sender.
Dashboard Three
Overview of Transport Layer security.
This dashboard can be used to:
Monitor volume of messages received and delivered using TLS, volume of messaged received/delivered without TLS, TLS versions used, Top Ciphers by types used with TLS, inbound and outbound sending domains that do not use TLS.
Dashboard Four
Overview of URL Protect events.
This dashboard can be used to:
Monitor TTP URL event volumes, URL source route, URL categories, top 10 blocked URLs, Browser Isolation URLs.
Dashboard Five
Overview of virus detection events.
This dashboard can be used to:
Monitor email virus detection volumes, top 10 virus signature detections and targeted users, virus detections by file extension and virus detection by source IP address.
Troubleshooting
This application has been developed and is supported by Mimecast. In case of technical questions, contact Mimecast support at https://community.mimecast.com/s/contactsupport. For issues with content or the Hosted Collector, contact Sumo Logic support at support@sumologic.com.
Comments
Please sign in to leave a comment.