Overview
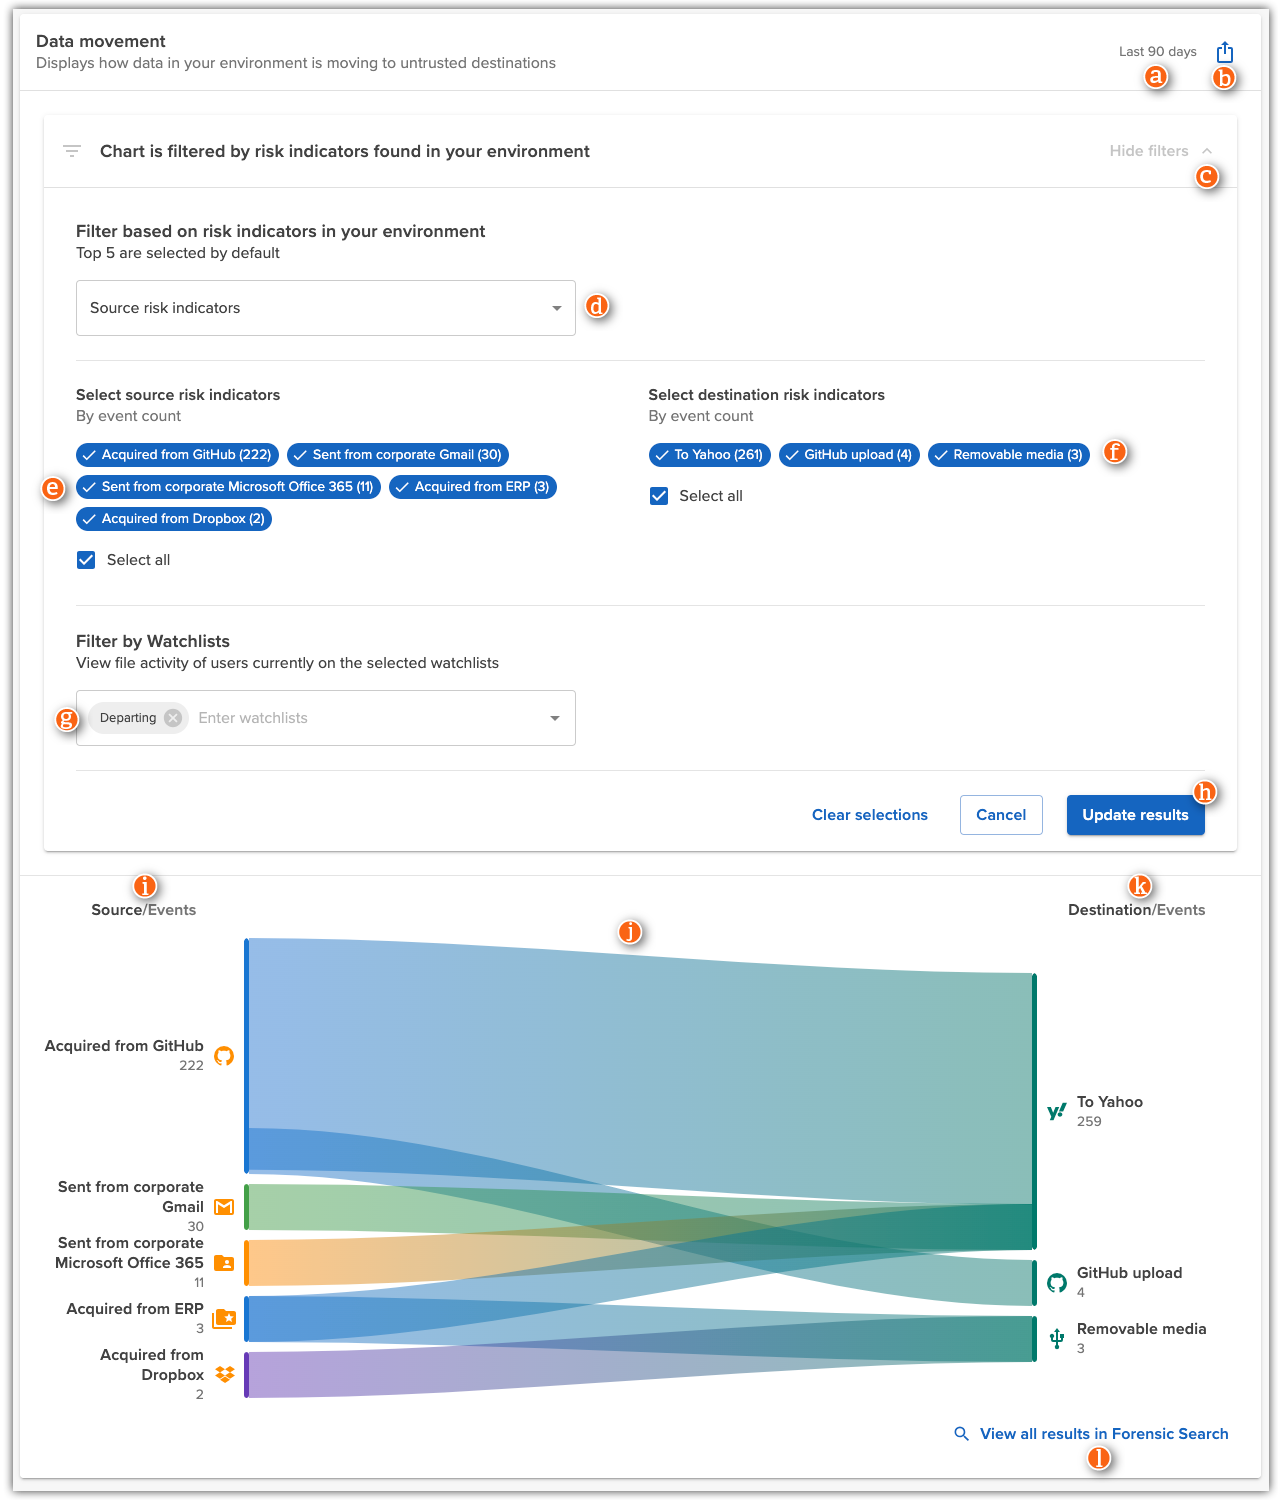
The Data movement graph on the Exfiltration dashboard shows how data in your environment is moving to untrusted destinations. This graph enables you to easily identify the greatest sources and destinations of exfiltrated files across all risk categories.
For more information about dashboards, see:
Data movement
To view data movement to untrusted destinations:
-
Sign in to the Incydr console.
- Select Dashboards > Exfiltration.
The Data movement graph appears at the top of the dashboard.
- Click Show filters to view and update the risk indicators included in the graph.

| Item |
Description |
| a |
Selected time frame |
Shows the time frame the file activity occurred in. Change the time frame in the upper-right corner of the page.
|
| b |
Export |
Click to save an image of the data movement graph.
|
| c |
Show / hide filters |
Click to collapse or expand the filters applied to the data movement graph. By default, the graph displays the 5 source risk indicators with the highest event counts in your environment. |
| d |
Risk indicator type |
Defines which type of risk indicators appear on the left side of the graph. Choose from:
- User risk indicators
- Source risk indicators (default)
- File risk indicators
|
| e |
Risk indicators
|
Displays all risk indicators of the selected type (d) that have occurred in your environment.
The top 5 risk indicators (by event count) are selected by default. Click any risk indicator to select/deselect it and add/remove it from the graph. Click Update results to apply changes.
|
| f |
Destination risk indicators |
Displays all destinations for the file events selected on the left (e).
The top 5 risk indicators (by event count) are selected by default. Click any risk indicator to select/deselect it and add/remove it from the graph. Click Update results to apply changes.
|
| g |
Filter by Watchlists |
Select one or more watchlists to filter the activity in the graph to users currently on a watchlist. For example, select Departing to review where departing employees are sending data. |
| h |
Update results |
Click to refresh the graph after changing the filter selections. |
| i |
User/Source/File risk indicators |
Displays the risk indicators included in your filter selection, along with the count of events for each risk indicator.
Hover over a risk indicator for more details. Note: If multiple risk indicators are applied to a single event, the sum of risk indicators in the detailed view may not match the raw number of events.
Click a risk indicator to view the events in Forensic Search.
|
| j |
Destination/Events |
Displays the destination risk indicators for the file events on the left, along with the count of events for each destination.
Hover over a risk indicator for more details. Click a risk indicator to view the events in Forensic Search.
|
| k |
Data flow lines |
Displays a visual mapping of files moving to untrusted destinations.
Hover over any section to view more details. Click a section to view the events in Forensic Search for that specific risk indicator combination.
|
| l |
View all results in Forensic Search |
Click to view all events displayed in the graph in Forensic Search. |
Related topics
Comments
Please sign in to leave a comment.